
Every export manager has watched a shipment sit in a bonded warehouse because the “obvious” market turned out to be the wrong one. Turkish furniture exporters chase Germany because it’s close and familiar, while Poland quietly imports more per capita in some furniture categories and has less price competition. Vietnamese seafood processors default to the US and Japan, while Middle Eastern demand for frozen shrimp has grown faster than either in the past three years. The phrase “top export markets” gets used loosely, sometimes meaning the biggest global trading economies, sometimes meaning the best market for your specific product. Those are different questions, and conflating them wastes marketing budget. This article separates the two and gives a process for finding your actual top markets, not the generic ones everyone assumes.
What “Top Export Markets” Actually Means
There are two distinct ideas hiding under this phrase, and exporters need both.
The first is macro: which countries dominate global trade volume. This matters for context, competitor benchmarking, and understanding where global demand concentrates. China exported roughly $3.8 trillion in goods in 2025, nearly double the United States’ figure of about $2.2 trillion, according to WTO trade statistics compiled with UNCTAD. Germany, the Netherlands, Japan, and South Korea round out the next tier. These figures matter if you’re benchmarking your country’s export performance or scouting where competitors are shipping, but they tell you almost nothing about where you, specifically, should be selling.
The second idea is micro and it’s the one that actually pays invoices: which countries import the most of your specific product, from suppliers like you, at prices and volumes you can serve. A Turkish exporter of ceramic tile does not care that China leads global exports. They care that Saudi Arabia imported over $400 million in ceramic products in a recent 12-month period and that import volume from Spain into that market has been flat while Turkish market share has grown, a pattern visible in ITC Trade Map data at the HS code level. The rest of this article focuses on the second definition, because it’s the one that changes what you do this quarter.
Export 5.0 identifies buyers and suppliers in your target market within seconds, analyzes trade trends and your target markets with up-to-date data, and enables you to reach corporate contacts of companies. It offers a powerful digital infrastructure for strategic marketing.
How to Identify Your Real Top Export Markets
Start with your own HS code, not your industry label. “Textiles” is not a market category; HS 6109 (T-shirts, knitted) behaves nothing like HS 5407 (woven synthetic fabric) in terms of buyer geography or tariff treatment. Pull your product’s exact HS code and look at three layers of data.
First, global import demand by country: which nations import the largest volumes of your HS code, sourced from any origin. This is available through UN Comtrade, though the interface is slow for repeated country-by-country pulls. Second, your country’s current export distribution for that code: where are exporters from your home market already shipping, and at what growth rate year over year. Third, and this is where most exporters stop too early, the gap between the two: countries with high total import demand for your product where your home country’s export share is low or declining. That gap is where the opportunity sits, not in the markets everyone else is already saturating.
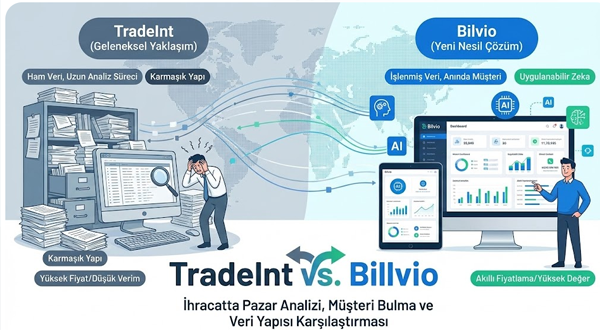
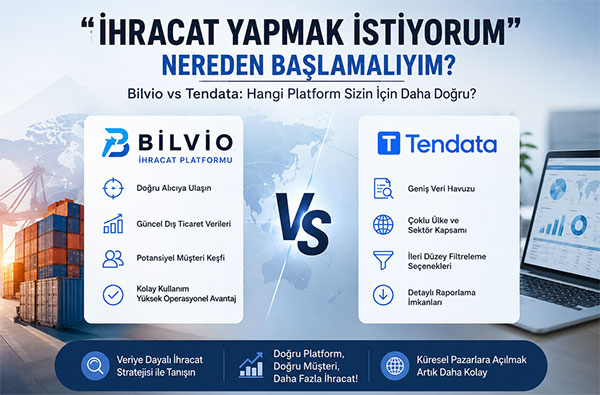
This is the exact workflow that trade intelligence platforms exist to compress. Instead of cross-referencing three separate government databases with inconsistent HS classifications, a platform like Bilvio’s export intelligence tools pulls customs and bill-of-lading data to show which countries are actively importing a given product code, which companies are receiving those shipments, and how that demand has shifted over recent quarters. For an SME without a dedicated market research analyst, that’s the difference between a two-week desk research project and an afternoon.
Ranking Markets by More Than Volume
Total import volume is the first filter, not the only one. A market can import a large volume of your product and still be a poor target for reasons that only show up once you dig further.
Tariff exposure matters more than most exporters price in upfront. A product facing a 12% MFN tariff into one market and a 0% preferential rate into another under a free trade agreement can flip the economics entirely, even if the second market’s total import volume is smaller. Turkish exporters shipping into EU markets under the Turkey-EU Customs Union have a structural advantage over competitors from countries without that arrangement, and that advantage should weight market selection, not just get mentioned as a footnote.
Import concentration is the second factor. If a market’s import demand for your product is controlled by two or three distributors who already have entrenched supplier relationships, your effective addressable demand is much smaller than the headline import figure suggests. Bill-of-lading records reveal this concentration directly: you can see how many distinct importers are receiving shipments of your HS code and how much volume each one handles, which tells you whether a market is genuinely open or already locked up.
Payment risk and logistics reality round out the picture. A market with strong import demand but a track record of LC delays or a customs clearance process that regularly adds three weeks to lead time needs to be priced into your decision, not discovered after the first shipment.
Regional Patterns Exporters Should Know in 2026
A few patterns are worth naming directly rather than hedging around.
The Gulf states, especially the UAE and Saudi Arabia, have become disproportionately important destinations for a wide range of manufactured goods relative to their population size, driven by re-export hub activity in the UAE and domestic infrastructure spending in Saudi Arabia under Vision 2030. Exporters underweight this region because it doesn’t carry the brand cachet of Germany or the US, and that underweighting is a mistake for categories like building materials, food processing equipment, and consumer packaged goods.
Eastern European markets, particularly Poland and Romania, have grown as manufacturing and assembly hubs that pull in intermediate goods, not just finished products. If you sell components rather than finished consumer goods, these markets often show stronger import growth than Western Europe with less price pressure.
Africa remains underexploited by most exporters outside a handful of commodity categories, largely because trade finance and logistics friction are real and shouldn’t be waved away. But Kenya, Nigeria, and Egypt have shown consistent import growth in processed food, packaging, and light industrial goods, and competition from established exporters is thinner than in saturated markets. The OECD’s trade and development analysis has repeatedly flagged this gap between African import demand growth and the concentration of exporter attention elsewhere.
China’s own import side is worth a second look for exporters who only think of China as a competitor. Chinese demand for specific inputs, specialty chemicals, certain agricultural products, high-end machinery components, has grown even as its export dominance holds. Treating China purely as a rival exporter rather than also a buyer misses real volume.
[Turkey-EU Customs Union tariff advantages by product category](INTERNAL: guide to customs union benefits for Turkish exporters)
Validating a Market Before You Commit Marketing Spend
Desk research narrows the list. Before you commit a trade show budget or a distributor search to a market, validate it against actual shipment behavior, not just aggregate trade statistics, which can lag six to twelve months behind current conditions.
Bill-of-lading records give you a near real time view: which companies in your target market received shipments of your product category in the last quarter, from which countries, and in what volumes. This lets you answer three practical questions before you spend anything. Is import volume actually growing right now, or was the annual statistic inflated by one large shipment. Who are the active buyers, by name, not just “distributors in this sector.” And who are you actually competing against in that specific market, since your national trade statistics don’t show you that a competitor from Vietnam has been quietly building share in the same Indonesian market you’re evaluating.
This is the layer where customs-data platforms earn their keep for exporters who’ve moved past the “which country should we target” question and into “which companies in that country should our sales team call first.” A platform that surfaces buyer contact data alongside shipment history turns a market decision into an actual prospect list, which is the point where market research stops being an academic exercise and starts generating pipeline.
[How to build a buyer prospect list from customs data](INTERNAL: buyer discovery workflow using shipment records)
[Competitor shipment tracking for export sales teams](INTERNAL: competitor monitoring feature overview)
Common Mistakes When Choosing Export Markets
The most frequent error is anchoring on market size instead of market fit. The US and Germany show up on every exporter’s shortlist because they’re the largest economies, not because they’re necessarily the best fit for a specific product and price point. A mid-sized exporter with no existing brand recognition entering the US market is competing against far more entrenched supply chains than the same exporter entering a mid-sized market where import volume is smaller but competitive density is much lower.
A second mistake is treating a region as one market. “The Gulf” is not a market; Saudi Arabia’s import regulations, SASO certification requirements, and distributor landscape differ meaningfully from the UAE’s, and both differ again from Qatar. Exporters who research “the Middle East” as a bloc end up under-prepared for the country-specific compliance work.
A third mistake is ignoring your own export history. If your company has shipped to a market before and stopped, that history contains information: was the relationship lost to a competitor, did payment terms break down, did a regulatory change price you out. Trade intelligence data can show you whether the overall market has recovered or continued the trend that pushed you out, which should inform whether re-entry is worth pursuing.
Frequently Asked Questions
What are the top export markets for 2026?
It depends entirely on your product category and HS code; there is no universal answer. At the aggregate level, China, the United States, Germany, the Netherlands, and Japan remain the largest global exporters by value according to WTO statistics, but the top import destinations for your specific product may be entirely different, smaller markets with less competition.
How do I find the best export market for my product?
Identify your exact HS code, then compare global import demand for that code against your country’s current export distribution to find gaps: markets with high import demand and low market share from exporters in your home country. Cross-reference with tariff treatment, import concentration, and recent shipment activity before committing budget.
Is China still the top export market to target?
China is the world’s largest exporter, but it’s also a significant importer for specific input categories like specialty chemicals, machinery components, and certain agricultural products. Whether it’s a target market for you depends on whether your product fits an import gap rather than competing with domestic Chinese manufacturing.
How often should exporters reassess their target markets?
Quarterly at minimum for active markets, since bill-of-lading and shipment data update far more frequently than annual trade statistics. Annual trade data can mask a market that peaked eight months ago or one that’s accelerating faster than last year’s numbers suggest.
What’s the difference between a top export market and a top trading partner?
A top trading partner is usually defined by your country’s existing bilateral trade relationship and often reflects geographic proximity or historical ties, like Turkey and Germany. A top export market, for your specific product, may be a country with no established trade relationship at all but strong unmet import demand for that exact HS code.
Do free trade agreements change which markets should be a priority?
Substantially. A preferential tariff rate under an FTA can offset a smaller total market size, and exporters should weight FTA-covered markets higher than raw import volume alone would suggest, particularly for price-sensitive product categories where a tariff differential of even 5 to 10 percent changes competitiveness.
Choosing a top export market is a data problem before it’s a sales and marketing problem. The exporters who get this right stop starting with “which country should we target” as a guess and start with HS-code-level import data, then validate against actual recent shipment activity before a single trade show booth or distributor call gets booked. That order, data first, outreach second, is the difference between a target list that converts and one that just feels familiar.